Why More Dashboards Can Make Shop-Floor Decisions Harder
A meeting room features dashboards displaying order fulfillment rate, equipment efficiency, quality trends, work-in-progress, personnel workload, and exception rankings. Data updates daily with clear color coding. However, when the factory owner asks, 'Can this urgent order be delivered by this afternoon?' the planner checks the order, the production manager checks the equipment, the quality inspector checks the pending samples, and the warehouse manager checks the bill of materials. Each person finds justification on their screen, yet no one provides an actionable answer.
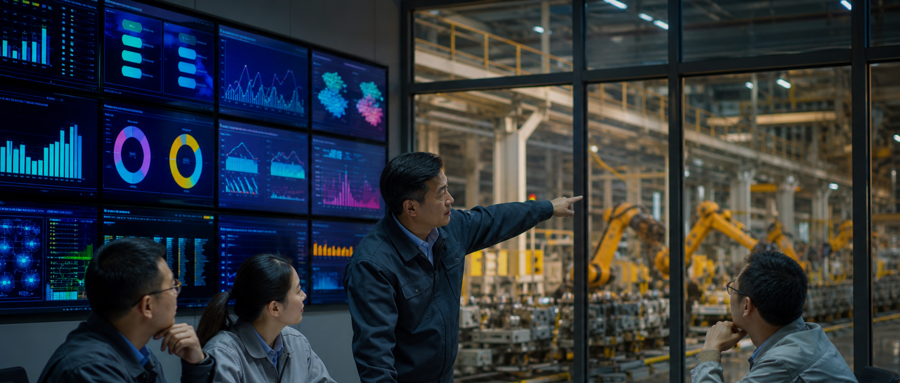
A meeting room displays order fulfillment rate, equipment efficiency, quality trends, work-in-progress, personnel workload, and exception rankings. Data updates daily, and colors are prominent. However, when the factory owner asks, 'Can this urgent order be delivered this afternoon?' the planner checks the order, production checks the equipment, quality checks the inspection results, and warehouse checks the bill of materials. Each person finds reasons from their own screen, yet no one provides an actionable answer.
This is the new challenge many factories face after digitalization: more dashboards, but decisions are not faster. The issue is not insufficient data, but rather each dashboard describes the world without clearly supporting a specific decision. For factory owners, dashboards should truly provide shop-floor interpretation, not just increase the number of screens.
1. The Easiest Replacement for a Dashboard Is Discussion, Not Action
In the past, meetings relied on verbal reports, but digitalization has changed this into taking turns showing screens. The format has changed, but responsibility has not. Production says equipment utilization is normal, quality says first-pass yield has dropped, and planning says delivery risk has increased. All three sets of data may be true, but they differ in time frame, scope, and priority. Putting them together does not automatically lead to a conclusion.
Real-time decisions on the shop floor are usually specific: whether to insert an order, stop the line, approve a batch, change equipment, or move maintenance from another line. If dashboards cannot help answer these questions, they are just making the original reports look better.
Some factories treat 'real-time' as the ultimate value. Although second-level updates are advanced, if an anomaly is not acknowledged for ten minutes, real-time data has not entered action. Faster data and faster organizational response are two different things.
2. The More Indicators There Are, the Easier It Is to Hide Responsibility in the Average
Managers prefer comprehensive metrics because they are easy to compare. However, problems often occur below the average. A line's overall fulfillment rate may look good, but it does not mean the bottleneck process is not backed up; an increase in equipment efficiency does not mean the required equipment for an urgent order is available; a stable quality pass rate does not mean a critical batch has been approved.
When a dashboard serves multiple roles such as the factory owner, plant manager, planner, team leader, and operator, it easily ends up displaying all the numbers each person wants to see. In the end, each role can only find partial relevant information and has to return to the group to ask for more details.
This is also a permissions issue. Operators can only handle abnormalities at their current workstation, yet they constantly see monthly profit figures. Team leaders need information on unresolved stoppages and staff shortages, but they are asked to monitor dozens of operational indicators. The more data that is beyond a role's influence, the more likely it becomes that they will think, 'This is not something I can decide.' If someone sees a red alert but lacks the authority to take ownership, proactive handling may lead to errors. The safest behavior becomes doing less and waiting for instructions; therefore, dashboards must also provide escalation and closure paths.
3. A Good Dashboard First Defines a Decision
Rather than first asking, 'What indicators are still missing,' start by asking, 'Who needs to make a decision at what time.'
The dashboard for team leaders can focus on in-shift scheduling: plan gap, current bottleneck, unresolved abnormalities, and items needing escalation. The dashboard for the shop floor manager can support cross-shift and cross-department coordination: four-hour delivery risk, material completeness, key equipment status, and quality pending decisions. The dashboard for the factory owner should support resource allocation: which order commitments are at risk, where the losses come from, which issues recur, and who is responsible for closure.
Three levels can use the same set of facts but cannot simply replicate the same screen. On the shop floor, decisions are made in minutes and based on specific equipment. At the management level, decisions are based on orders, shifts, and resources. Data needs to be aggregated, and responsibility must also be clearly defined.
4. Before Deleting the Dashboard, Do Four Checks
First, write down the single core decision that this dashboard supports. If you cannot explain it in one sentence, it may simply be a collection of information.
Step two, clarify the triggered actions. Once the red status appears, who is responsible for acknowledging the issue, how quickly they should respond, and who to escalate to if the response is delayed. Without action rules, the color is just a reminder.
Step three, check whether the metrics can trace back to original facts. The reason an order risk turns red should be visible as missing materials, machine downtime, pending inspection, or process changes, rather than just a composite score.
Fourth, check whether users have the necessary permissions. Allowing a team leader to see a decision requiring approval from the plant manager without providing an escalation path will increase anxiety without improving execution.
When creating a new dashboard, it should also address the exit condition: once the process is stable, can this screen be merged or removed? Digital transformation is not a competition of screen numbers. Any dashboard that fails to drive action over time should be closed.
5. What the Factory Owner Should Really Ask Is Not 'Complete Data'
The owner can conduct weekly spot checks on three things: whether the red items on the dashboard have responsible parties, how long it takes for an anomaly to be acknowledged after it appears, and whether similar issues recur after closure. This check is closer to operational outcomes than pursuing more charts.
For small, loosely managed factories, the first step may simply be to place key anomalies and order risks on the same board. For mid-sized growing factories, the focus is on aligning cross-departmental metrics and escalation rules. For large or mature factories, the emphasis should be on preventing excessive layers, redundant metrics, and role overreach. Not all factories should reduce their dashboard numbers to the same level, but each dashboard must serve a clear role and clear action.
The plant manager can forward this checklist to planning, production, quality, and equipment departments to remove metrics that lack users, actions, and closure mechanisms. The value of a dashboard lies not in proving how much data the factory has, but in enabling someone to make a better decision faster at a specific moment.
What the shop floor needs is not more screens, but a short feedback loop from anomaly to responsibility, from responsibility to action, and from action to result. Only dashboards that shorten this loop are worth keeping.