Too Many Dashboard Colors? Why Management Misses Delivery Risk
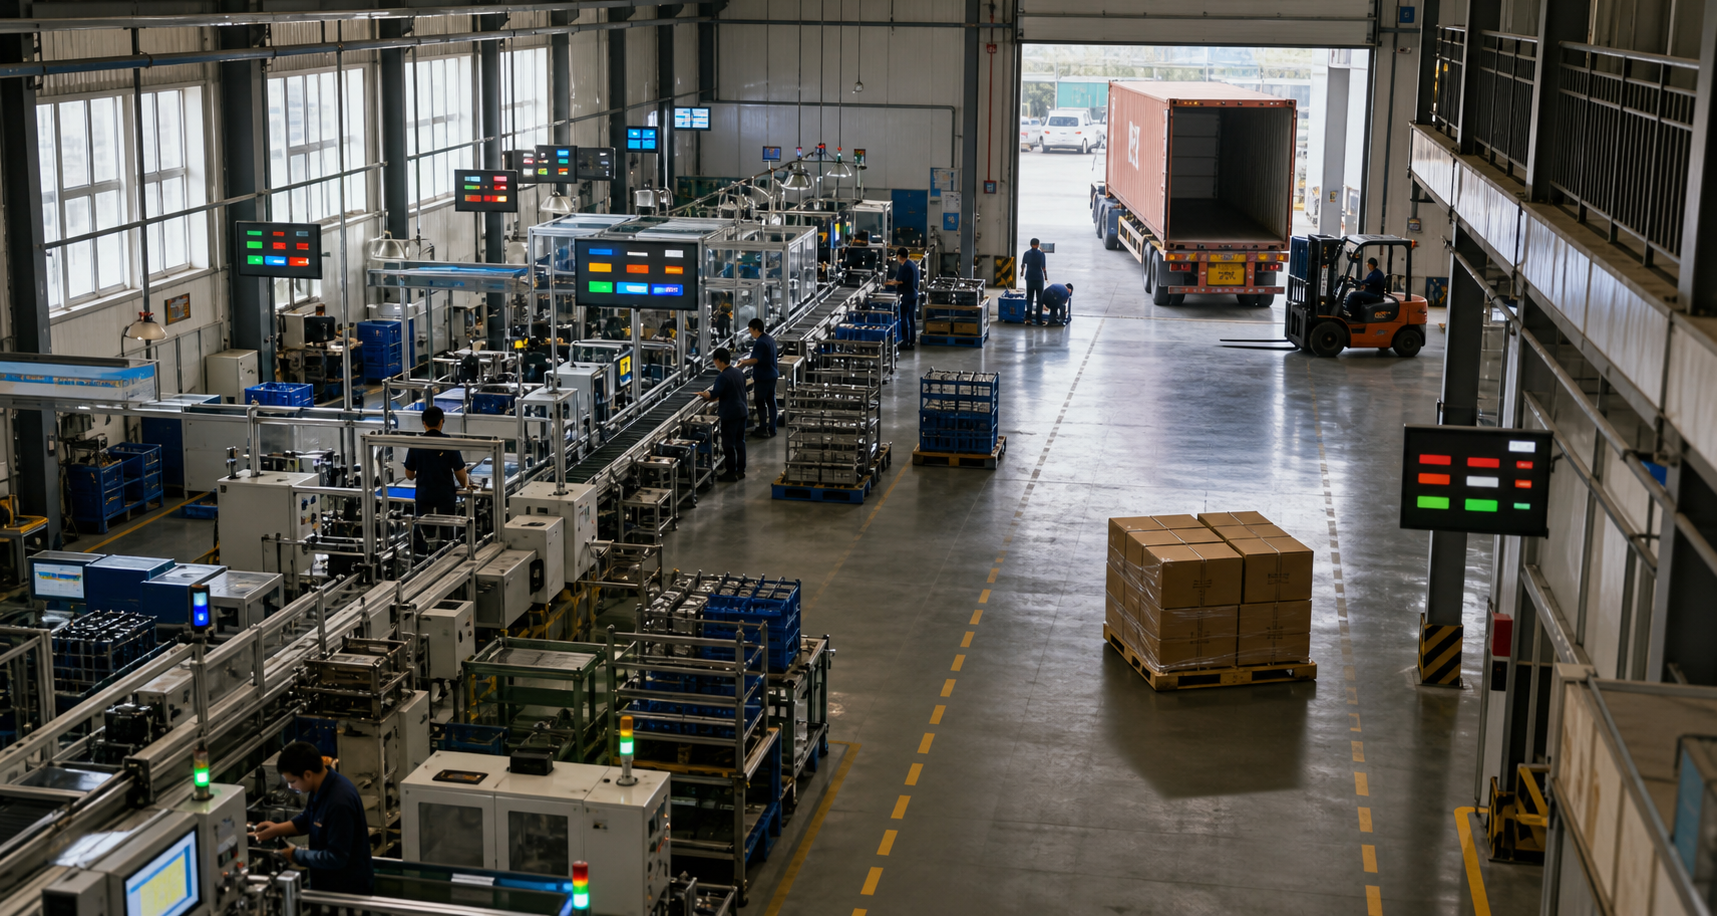
Many factories' meeting rooms now feature production dashboards that update in real time. Output, yield, downtime, work-in-progress, material shortages, and labor hours are displayed in red, yellow, and green. Despite the increasing screen clutter, management often only identifies real delivery risks when customers demand urgent action.
Why More Dashboard Colors Make It Harder for Management to See Delivery Risks
In many factories, production dashboards in meeting rooms can refresh in real time. Output, yield, downtime, work-in-progress, material shortages, and labor hours are all displayed in red, yellow, and green. Screens are becoming increasingly crowded, yet management still discovers actual delivery risks only when customers demand urgent action.
The issue is not insufficient data, but rather that colors compress different meanings into the same sense of urgency. When ten red lights appear simultaneously, frontline staff tend to address the most visible, loudest, and easiest-to-fix issue first, which may not be the one most impacting the order.
Colors Describe States, Not Consequences
A non-bottleneck machine stopping for ten minutes can turn red, and a critical order missing its unique tooling can also turn red. Both are visually equivalent, yet their impact on delivery differs significantly. If managers only focus on the number of colors, they will distribute resources unevenly across uneven risks.
More troubling is that many indicators only inform people that something is off without explaining when the deviation started, how much buffer remains, which order is affected, and who has the authority to take action. As a result, red becomes a notification rather than a basis for judgment.
A Truly Effective Dashboard Must Retain Context
The first level should only answer what must be held today. Rather than displaying dozens of metrics simultaneously, place customer commitments, key material availability, remaining bottleneck capacity, and pending release quantities along the same order chain. This allows people to first see the ultimate consequences.
The second level answers how deviations propagate. Material shortages can block which process, a bottleneck loss of one hour can delay which batch of orders, and quality hold-ups can consume how much available shipment quantity. Metrics are related, and management actions must follow a sequence.
The third layer addresses what can be done now. Each high-risk item should only retain the responsible person, next action, committed time, and evidence of closure. A red light without action is just background noise; a green light without verification cannot be considered truly closed.
Show Less, Judge More
Management can perform a simple test: randomly open a red indicator and ask the shop floor to explain within one minute the affected order, remaining buffer, current responsible person, and next reporting time. If all four points are not fully answered, it indicates that this dashboard has not entered the decision-making chain.
Factory owners can forward a one-page checklist to plant managers and shop floor supervisors: first verify order fields, second check responsibility boundaries, third review closure evidence. Management actions should be few and clear, so that team leaders understand their permissions and risks.
Job motivations also influence color changes. After an abnormal order is accepted, if only blame is assigned, the department will quickly transfer it or say 'not my responsibility'; if escalation, handling, cooperation, and closure have clear responsibilities, the red light will drive problem resolution rather than self-protection.
Check another green indicator and ask whether its recovery has led to downstream status improvements. If only a department has completed data entry and the order risk has not decreased, this green light needs to redefine the closure criteria.
Small factories do not need to replicate large command centers. The fewer screens, the more the order, bottleneck, and abnormal responsibility should be connected; mature factories with more data should also ensure that different levels only see decision information matching their authority, avoiding everyone facing the same wall.
Not all dashboards should prioritize delivery as the sole focus. Some factories may have safety or quality as their most urgent concerns, leading to different priorities; however, any color should indicate consequences and required actions, and it is not necessary to use the same set of thresholds across all departments.
The value of a dashboard lies not in proving how much data a factory has, but in shortening the time from signal to judgment, from judgment to action, and from action to verification. Colors can help draw attention, but they cannot determine priorities or replace shop-floor facts.
When management can trace the risk associated with an order, who handles it, and when it is verified along a single order, fewer charts do not reduce transparency. In fact, they can expose real delivery issues earlier and direct limited resources to where they are most needed.
I am Huang Chaoxing, inventor of the TreeMES stack-light MES system. Follow me for continued analysis of shop-floor management and digital transformation trends in manufacturing.