More Real-Time Dashboards—Why Management Still Chases Red Lights
During morning meetings, the large screen refreshes every minute. When equipment stops, it turns red, and the plant manager immediately asks questions; if production drops, the shop floor explains quickly. However, issues that haven't turned red but are accumulating often go unspoken.
Why Real-Time Dashboards Can Make Management More Likely to Chase Red Lights
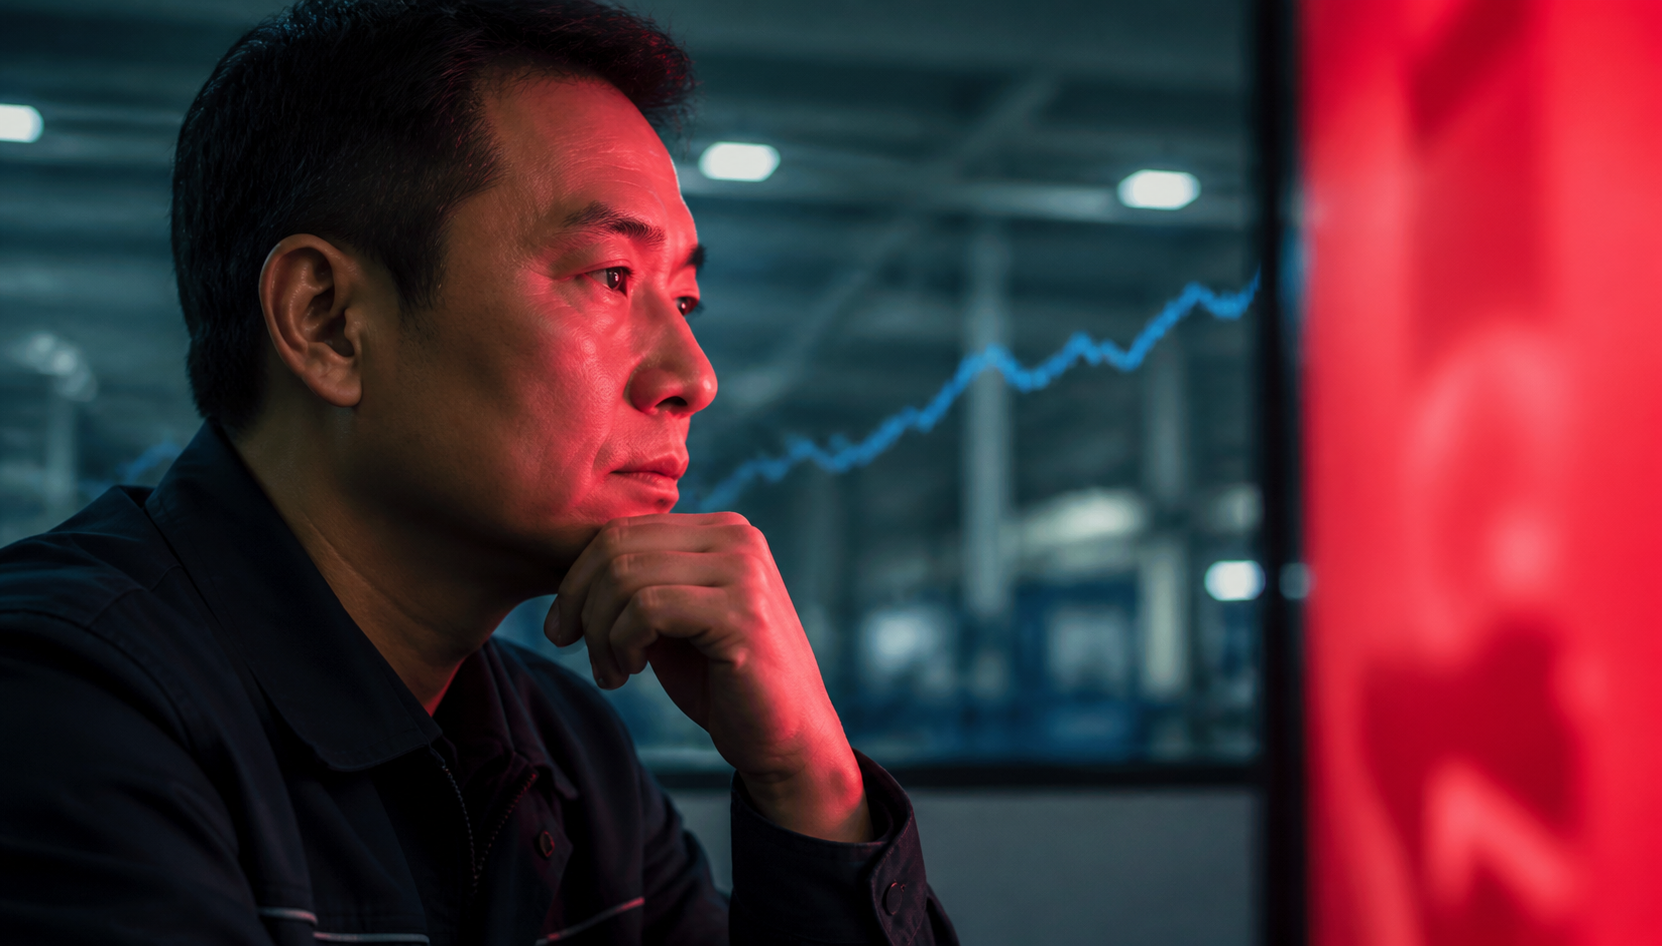
During the morning meeting, the large screen refreshes every minute. When equipment stops, it turns red, and the plant manager immediately asks questions; if production drops, the shop floor explains quickly. However, problems that have not yet turned red but are accumulating often go unspoken.
The purpose of the dashboard is to detect risks earlier. If management actions only revolve around red lights, it will train the organization into a fire-fighting team.
Red Lights Are Noticeable, But Often Indicate Past Events
Downtime duration, number of defects, and delayed orders are important outcomes. However, they describe losses that have already occurred. Brighter colors and faster refresh rates will not automatically turn outcome metrics into preventive indicators.
This observation mainly applies to mid-sized growing factories: data collection is already in place, but cross-departmental rules remain incomplete; management can see results but cannot see who has the authority to stop production before the result occurs.
The shop floor supervisor will quickly learn to protect themselves. As long as the numbers remain green, production continues; once they turn red, they first explain external causes. Proactively reporting potential issues increases workload and may also lead to taking responsibility prematurely.
A Truly Useful Dashboard Should Address Three Key Questions
First, what happened. Retain results such as downtime, defects, and delays to inform management of the scale of losses.
Second, what is deteriorating. Display leading signals such as tool life approaching its limit, waiting time for inspection materials, overdue planned maintenance, and abnormal shutdown timeouts.
Third, who takes what action. Each signal must be linked to a responsible person, deadline, and authority boundary, clearly defining when to escalate and when to transfer. A red light without an action entry only creates bystanders and urgency.
The three types of information should be placed on the same causal chain. For example, alongside 'increase in defects,' seeing first-off inspection deviation, overdue equipment inspection, and un-closed anomalies allows managers to determine where to start the investigation.
Chase Fewer Colors and Ask More Questions
Morning meetings should not spend all time explaining each red light. First, select a result indicator, then trace back two process signals: when did it start changing, who saw it at that time, and why was no action triggered?
If the answer is always 'the system reminded, but no one dared to stop,' the issue is with authorization; if it's always 'too many alerts to look at,' the issue is with thresholds; if signals are never collected, the issue is with management design.
Management should also protect genuine reporting. Proactively exposing risks that have not yet caused losses should be seen as lead time, not a new negative ranking. Otherwise, the more transparent the kanban, the later the data enters the system.
For cross-departmental issues, the dashboard should also display who is waiting for confirmation, how long they have been waiting, and what impact further waiting will have on the order. This way, the red light will not be simply passed to the shop floor, but will drive the person with the resources and authority to make a decision.
Not all factories need a complex set of metrics. Some factories should first address the distortion of basic data; however, if a real-time dashboard is already in place, the factory owner should be given a checklist of metrics, clearly stating the fields, responsibilities, and review cycles.
Measuring Dashboard Value Isn't About Refresh Speed
Focusing on three outcomes is more practical: how long it takes for a risk to go from appearing to being detected, how long it takes from detection to the responsible person accepting ownership, and how many issues are closed before they cause downtime, defects, or delays.
Also look at a reverse signal: whether the same type of red light appears repeatedly. The more repetition, the more it indicates that the organization is only handling the results without changing the underlying conditions.
The value of a real-time dashboard is not in enabling leaders to speed up their demands, but in allowing the shop floor to obtain action guidance earlier. Shifting attention from red lights to root causes is when digitalization truly enters management.
I am Huang Chaoxing, inventor of the TreeMES stack-light MES system. Follow me for continued analysis of shop-floor management and digital transformation trends in manufacturing.