
OEE Improved—Why Didn’t Delivery Performance Improve with It?
Equipment OEE has risen for three consecutive weeks, yet customer on-time delivery has not improved. Equipment and planning point to different bottlenecks, leaving management with two conflicting performance signals.
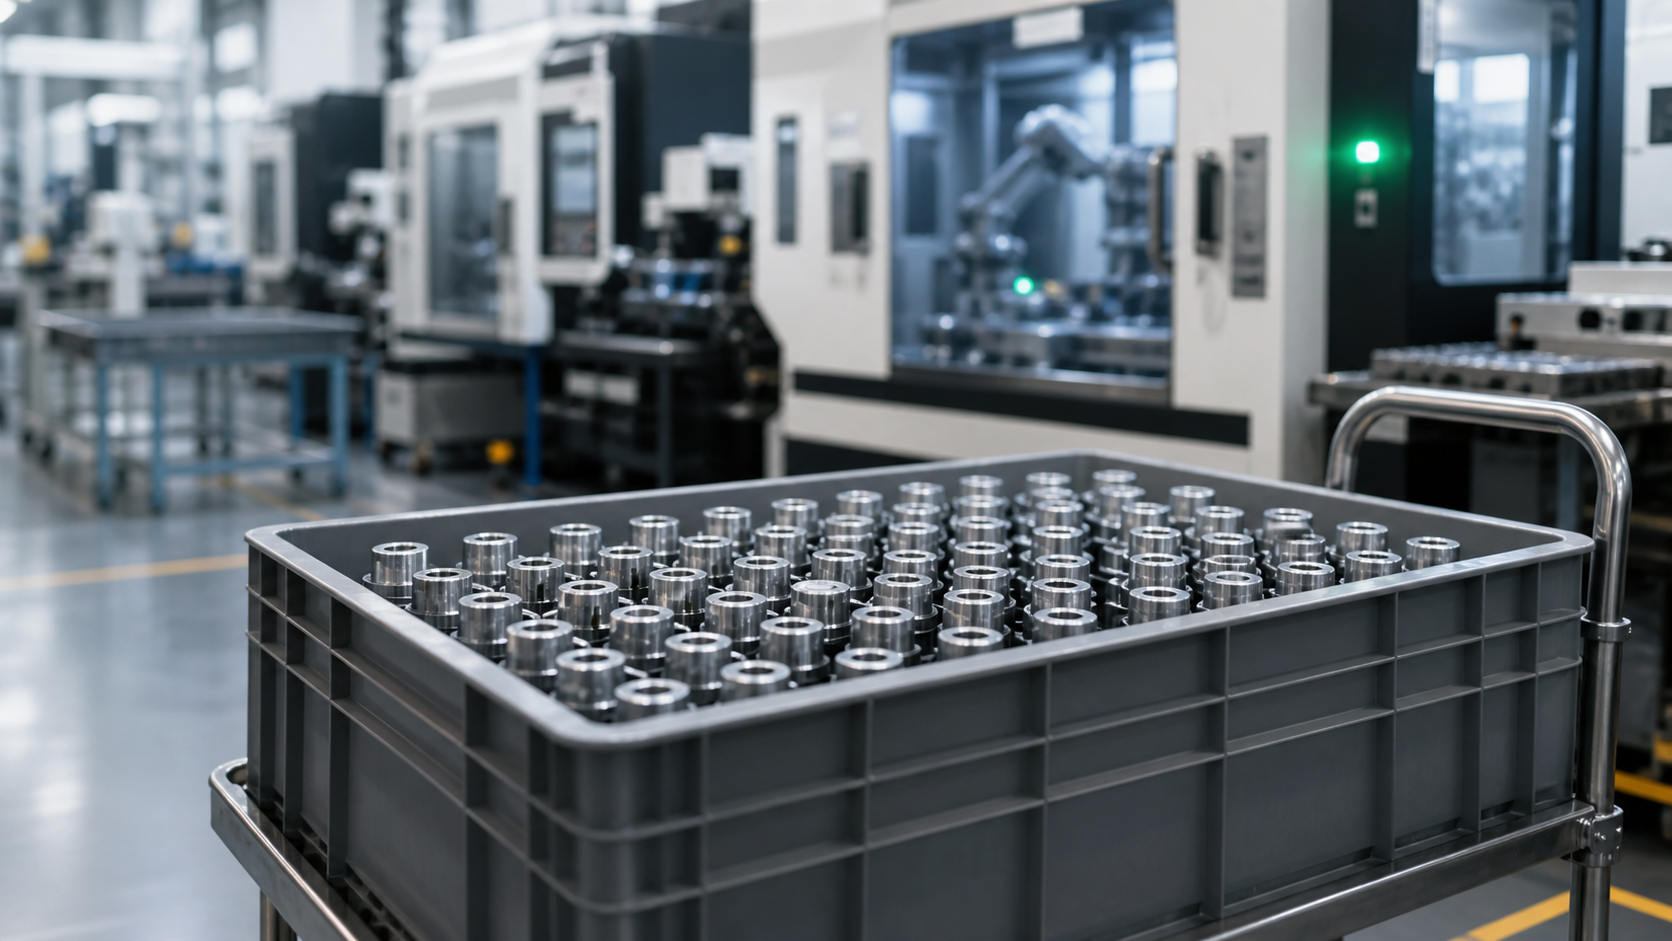
OEE has increased, why have order delivery times not improved at the same time?
At the monthly meeting, equipment OEE has risen for three consecutive weeks, yet customer on-time delivery remains unchanged. The equipment supervisor believes the improvement is being underestimated, while planning says the bottleneck is elsewhere. Faced with two conflicting performance signals, the factory owner does not know which team to reward or challenge.
This is not a failure of OEE; it is a local efficiency metric being used to answer an order system question. Improved equipment stability, speed, and yield are commendable; however, orders still require scheduling, component availability, changeovers, inspection, handling, and warehousing.
Factory owners need to clarify responsibilities, authority, and boundaries: the equipment supervisor explains equipment performance, the planning position explains order selection, and the plant manager oversees cross-departmental authorization. If risks are all borne by the questioner, the real self-preservation action is to report only favorable numbers.
An increase in the indicator does not mean the target is automatically achieved
The NIST and ASME manufacturing monitoring report summarizes OEE as a measure of the relative completeness of manufacturing potential, commonly calculated using availability, performance, and quality. It primarily addresses how well equipment or operations performed during planned production time.
Customer delivery performance, however, answers whether orders can be completed within promised timeframes. Although related, they are separated by in-process waiting, inter-process synchronization, order priority, and material constraints. Confusing correlation with equivalence can lead to improvement efforts stopping at the most measurable point.
More troubling is that local OEE can rise even when orders are not moving faster. Equipment producing long batches reduces changeover losses, making numbers look better; however, urgent orders may be at the back of the queue, and the in-process goods from earlier production may block pathways and inspection capacity.
First, determine which level this indicator belongs to
NIST's manufacturing performance research highlights that individual processes and broader manufacturing systems require different analysis boundaries. Without clear boundaries, data from equipment, production lines, and factories can be mixed together, allowing each party to select a chart that favors their perspective.
Another NIST study points out that manufacturing KPIs such as efficiency, throughput, and availability are not independent; there is a dependency among basic, composite, and supporting metrics. Managers should focus on the path through which OEE changes impact orders.
After increasing equipment OEE, three connected metrics can be continuously tracked: whether the effective output of the bottleneck process has increased, whether the waiting time before the bottleneck has decreased, and whether the cycle time from production to warehouse for a complete order has shortened.
If the first metric increases while the latter two remain unchanged, the issue may have shifted to inspection, handling, or scheduling. If equipment output increases but work-in-progress also increases, it indicates the factory is simply manufacturing faster but still waiting.
Perform order penetration once a week
Select ten recent delayed or nearly delayed orders, write reasons without departmental categorization, and mark out the timeline with commitment date, complete order date, production start date, entry and exit times of key processes, inspection completion, and warehouse entry times.
Then place the OEE changes during the same period on the timeline and ask three questions: where did the improvement occur, did the order pass through that equipment, and was the time released by the improvement consumed by subsequent waiting. Do not force calculate improvement benefits for orders that did not pass through the improved equipment.
Create a checklist with three fixed fields: order, equipment, and time. During weekly reviews, verify each item: who accepted the order, who handled it, when it was escalated, when it was transferred, and who closed it. Avoid letting analysis stop at departmental explanations.
The equipment supervisor is responsible for explaining changes in availability, performance, and quality. The planning department handles order priority and complete kits. Quality and logistics manage the waiting period. The factory owner must authorize cross-departmental verification and avoid turning deep analysis into an additional responsibility for any single role.
Small factories can start with ten orders and one bottleneck line. Growing factories should link order cycles with equipment metrics. Mature factories should be cautious of departmental metric optimization squeezing system goals. Not all factories need the same complexity; the boundaries of metrics must be clearly defined.
True OEE improvement doesn't just turn equipment charts green; it also explains how much shorter certain orders waited as a result. If the explanation is unclear, don't discredit the equipment team, but continue tracing along the order flow to find the next constraint.
I am Huang Chaoxing, inventor of the TreeMES stack-light MES system. Follow me for ongoing analysis of shop-floor management and digital trends in manufacturing.